GRACE-based hydrological drought evaluation of the Yangtze River Basin, China
In this study, hydrological drought in the Yangtze River basin (YRB) is characterized based on Gravity Recovery and Climate Experiment (GRACE) total water storage (TWS). An artificial neural network approach is applied to extend the GRACE TWS observations (2003–12) to a longer TWS time series (1979–2012), which is well matched (Nash–Sutcliff efficiency of 0.83) to the GRACE data. Hydrological drought is identified by water storage deficit (WSD; the shortfall in TWS from the average value) in three consecutive months. The method builds on previous research by considering potentially ineffective interdrought events and by characterizing drought recovery time from a multidecadal TWS time series. The results show that the YRB was in hydrological drought 29 times during 1979–2012, and the three subbasins of the YRB (upper, middle, and lower YRB) experienced between 21 and 28 hydrological drought events during the same period. The drought recovery time, defined as the time required for WSD to recover to average conditions, is evaluated by a simple statistical approach based on the empirical cumulative distribution function. The average drought recovery time is 3.3 months for the entire YRB and ranges from 2.3 to 3.4 months for the three subbasins. The severest YRB drought occurred during 2003–08 as a result of below-average precipitation, high temperatures, and intense human activities. The results demonstrate that GRACE data are useful for reconstructing the TWS time series for a large river basin, from which hydrological drought can be characterized, and for investigating spatial and temporal trends in water storage conditions.
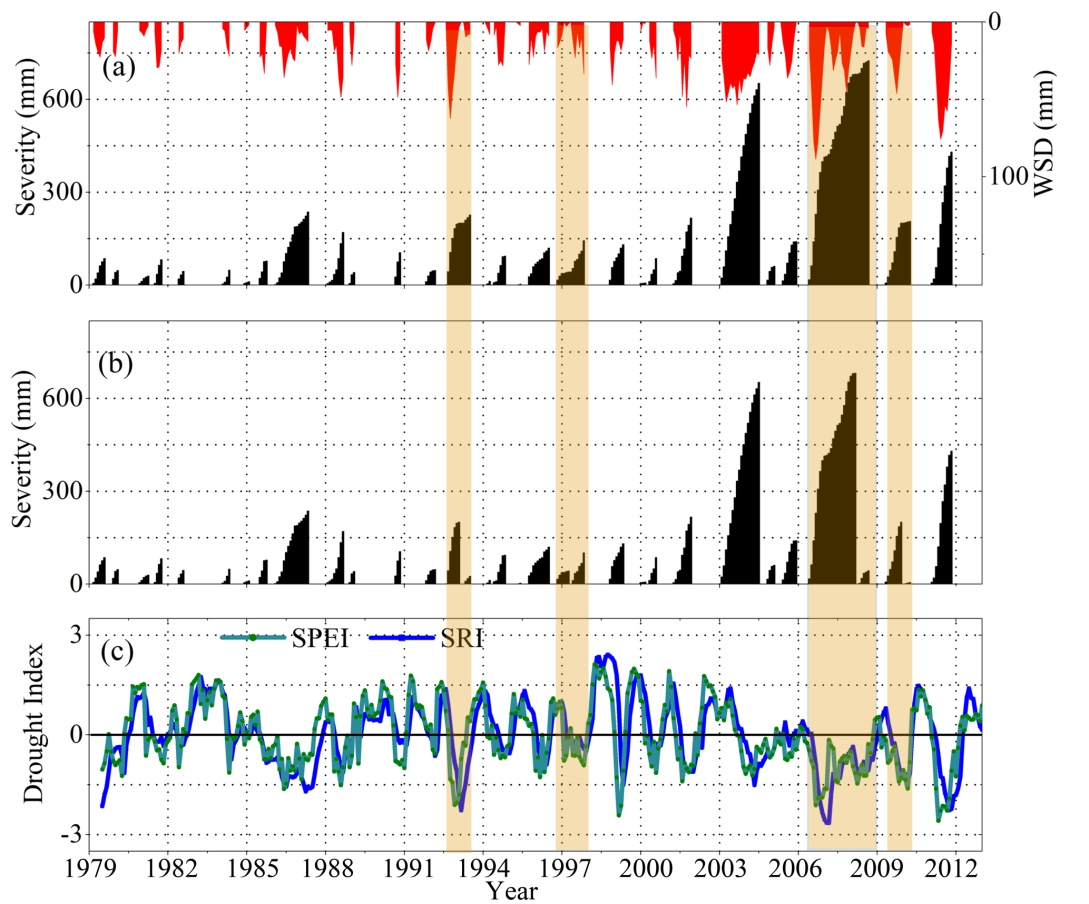
(a) Hydrological drought severity (black bars) based on the extended GRACE data in the entire Yangtze River Basin; (b) hydrological drought severity by the method of Thomas et al. (2014), and (c) SPEI and SRI for the Yangtze River Basin during 1979–2012. The red area represents the Water Storage Deficit (right y axis). The orange rectangle represents drought includes inter-drought periods.
Full-text URL: http://journals.ametsoc.org/doi/abs/10.1175/JHM-D-15-0084.1